|
DvC1-00 (Introduction & Shallow Gas) - 
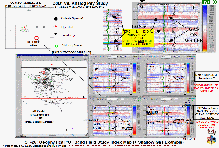
Figure DvC1-00, shows some classic "D3D versus Conventional" processing examples of shallow gas-on-water in Pleistocene, layered-earth geology. These shallow, high-resistivity gas sands were logged in a deeper EPL exploratory well. The base map in the upper left corner shows the location of the "D3D versus Logged Pay" wells studied near ST-26, and then tabulated on the scoreboard (see Figure DvC2-00). The red circled well was a deeper dry hole (conventional "O" sand amplitude anomaly target) drilled by EPL, with secondary objectives up the hole in a pair of small, conventional Bright Spots. It is the two small gas pockets on which this Figure focuses, using NS and EW crossing lines (red on index map) to compare the pay signatures on the D3D-impedance line, versus the more conventional DMO (Dip Move-Out) "running-sum” impedance.
The upper-middle panel shows a west-east seismic cross-section that crosses these (conventional running-sum impedance) secondary-objective amplitude anomalies, along with the (green) gamma ray and (black) deep induction resistivity curves, logged in the Cayenne test well. The upper-right panel shows the "twin" (same horizontal and vertical scales) D3D-impedance line, on which the logged gas sand zones are represented by the anomalously low impedance (yellow) samples pressed buoyantly against the top of the otherwise pink, water-bearing sand. The upper-middle panel is a zoomed version of the more-or-less conventional running-sum inversion of (non-D3D-reprocessed) reflectivity data, called "DMO-impedance", shown un-zoomed immediately below. It is labeled "DMO-impedance" data because the D3D-prescribed processing sequence does not employ "Dip Move-Out" (DMO) filtering, commonly used on legacy 2D data in the Gulf of Mexico basin. The D3DSP contends that the primary goal of DMO filtering was not to "move dipping reflections to their proper subsurface positions" but, rather, to create the necessary, smooth, continuous layers needed for conventional structure and amplitude mapping, from the often jumbled 2D seismic reflection and diffraction responses generated by echoes from over-pressured, relatively UN-layered, frequently turbiditic, sand (and silt and shale) bodies. The D3DSP refers to such bodies as (common-impedance) "objects".
In this upper-middle panel, the highest negative-amplitude troughs (lowest running-sum "impedance" values) are colored yellow, and the pair of (blue-and-cyan) peak "side lobes", suggest that the conventional processing resulted in a narrower-bandwidth wavelet, with undesirable, high-amplitude side lobes. The D3D-impedance processing, shown in the upper-right corner, exhibits no such artificial high-impedance sediments, either above or below the gas pay zone. The D3D data are considered to be more accurate, because the gamma ray and induction resistivity log curves in the Cayenne well (green and black curves, respectively, no transit time logs were run this shallow) imply that the shale section, above the gas, is fairly uniform, with no particularly high-impedance shale above either pay sand. And, in the Gulf of Mexico basin, the normal-hydrostatically pressured wet sands (aquifers), beneath the gas pay zones, most often have lower velocities and densities than the encasing shales. This important characteristic of the D3D-processed data (a more accurate portrayal of the relative impedance of the sediments) is due to the D3D-reflectivity wavelet's broader bandwidth, which yields increased high and low Fourier frequency content for the reflection wavelet (see Figure DvC2-09). This, in turn, inverse-Fourier-transforms back into the time domain as a wavelet with a narrower, higher amplitude central spike, and lower amplitude symmetric (zero-phase is the D3D-processing goal) side lobes.
In the large montage in the bottom half of this Figure, all 100+ ST-26 wells are shown on the left-hand index base map. The positions of the two sets of "twin" seismic profiles are shown by the crossing red lines. These lines are shown to the right of the index map, and provide a direct comparison of the two shallow gas pay sand signatures, on a D3D-impedance inline and crossline pair (bottom) and the "twin" conventional (DMO) running-sum-impedance inline and crossline pair (top). In the shallow (near 3,000 feet deep), normal-hydrostatically pressured, Gulf of Mexico geologic section, clean sandy deposits are usually lower impedance (yellow, red, and pink, on the color bar) than the un-compacted shales (cyan and blue). The D3D-impedance of each gas sand, as denoted by the kick to the right (hydrocarbon fluids are higher resistivity than salty brines) on the black log curve, is anomalously low and therefore displayed in the lowest impedance color (yellow, on the color bar). The thicker wet sands are not as anomalously low impedance, but they are still lower (redder) than the surrounding (blue) shales. Note that no high-resistivity pay was found on the Cayenne well log, for the middle zone labeled "wet sand". The thin, high-resistivity blips actually correlate with a couple of thin (gamma-ray log) shales, not with clean (low natural gamma radiation) sandstones, and so are not interpreted to be pay zones. It is interesting, too, that internal permeability and porosity (sand "quality") barriers can be seen within the D3D-impedance pictures of these young sands, and an apparent gas pocket (yellow CIO) to the west of the logged Cayenne well, is separated from the logged pay zone by a higher relative (D3D-) impedance barrier. But additional CIO map-views show that both yellow gas sands are connected out of the plane of the section, shown here. Internal impedance variations are also visible within the wet (pink) portions of each of these three logged sand intervals.
As annotated on this Figure, the "DMO-running-sum impedance" processing only allowed the measurement of an approximate amplitude anomaly area, to be multiplied by a thickness estimate from the logged zones, to yield a very rough guess at the total recoverable gas. On the other hand, the D3D-impedance processing, combined with VoxelGeo's volumetric (seed-planting and CIO growth) capabilities (plus a required engineering Recovery Factor), permitted a much more precise and accurate estimate of both the precise area of low-impedance, and the laterally variable thickness, to give a more accurate volume of recoverable gas, in each reservoir.
|

