|
 DvC1-06 (ST26 "O" Sand Geologic Facies Map) DvC1-06 (ST26 "O" Sand Geologic Facies Map)
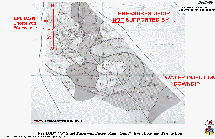
Figure DvC1-06 shows how classically trained geoscientists portrayed the D3DSP's reservoir compartment "objects" as facies changes in (possibly faulted) layers of the "O" sand reservoir. This mature reservoir has already produced over 90 mmboe (million barrels of oil, and gas equivalent), and the position of these "twin" N-S seismic lines (Figure DvC1-05) is shown in red on this production-geologic map. This reservoir portrayal was created for a 1997 ST-26 "O" Sand Field Study, and shows a compartmentalized deltaic sand "facies map". It also shows why it was so difficult to successfully implement a down-dip (southern) water flood, in this heterogeneous reservoir. In fact, it was only after the “O” sand’s initial production began to cause severe (but different) pressure drops in many of the wells, that an on-again-off-again water-flood program was put in place. Unfortunately, these southern "E-platform" water-injection wells showed the economic implications of all these "O" sand pressure compartments, within an assumed, thick reservoir "layer" … these compartments are perfect examples of the D3DSP's Common-Impedance "Objects" (or CIOs). Even with tens of millions of barrels of water injected into the down dip "O" sand, these southern injection wells apparently provided little pressure support for the northern, up-dip, producing wells.
Because the (short-) streamer cable 3D survey that was acquired (1989, right side of Figure DvC1-05) was unable to laterally or vertically resolve these pressure compartments, the facies map in this Figure had to be revised (with little seismic input) after the drilling of each new well. At a depth of approximately 11,000 feet, separate, drainable reservoir compartments just could not be seen, ahead of the drill bit, on either the older 2D seismic or the conventionally processed 3D seismic data. Again, see Figure DvC1-05 for a comparison with both the D3D-reprocessed (1997, OBC) data and the conventionally processed version (Dip-Move-Out applied, or DMO), purchased and reprocessed in 1998. The value of this facies map to the D3DSP, is in its portrayal of the many, more-or-less pressure-independent compartments within the larger, mostly deltaic, "O" sand package “layer”. Note also that the yellow sands, on the lower left-hand log cross-section of Figure DvC1-05, have the best quality reservoir sands as shown by the lowest SP and highest ILD (induction log - deep) resistivity values, and a few were logged D3D-appropriately (transit time and density) and found to have the lowest acoustic impedance … all within this complex, generally low-impedance, now significantly pressure-depleted, "O" sand (so-called Reservoir "D").
|

