|
 DvC1-09 (ST26 "O" Sand Jason D3D-thickness) DvC1-09 (ST26 "O" Sand Jason D3D-thickness)
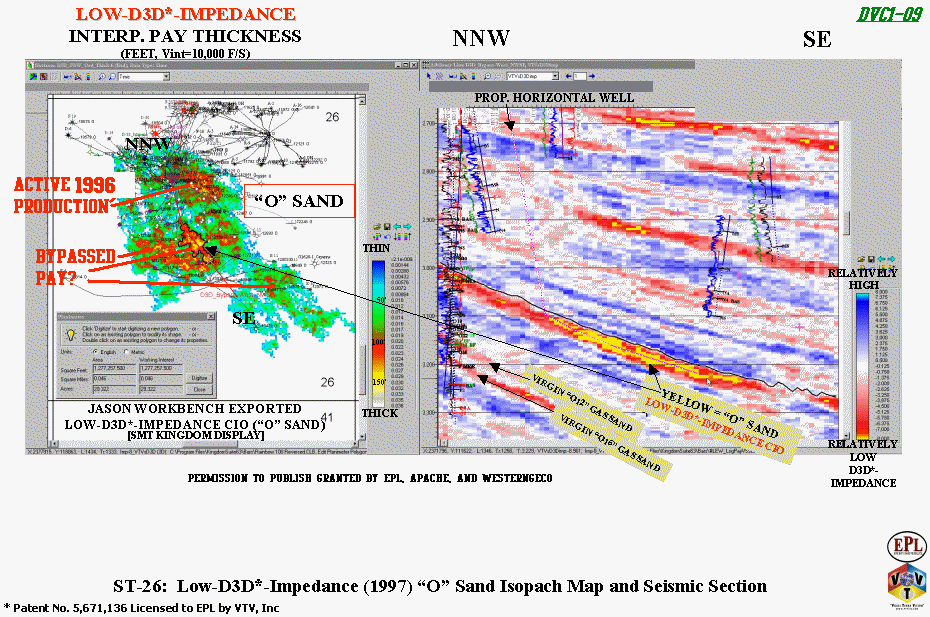
On Figure DvC1-09, the left-hand panel shows another map-view of the ST-26 "O" sand CIO, with its color bar modulated, not by the value of the D3D-impoedance, but here by the "vertical thickness" of low-D3D-impedance VOXELs, along each D3D-impedance trace (using the high-GOR oil sand velocity logged, 10,000 feet per second). The isopach values were calculated and color plot display produced by SMT's Kingdom 3dPAK application, using the two imported horizons (top and base of the detected "O" sand D3D-CIO) from Jason's Geoscience Workbench. Once again, the 1996 active production area (D3DSP interpreted, not necessarily accepted by engineers), as well as the D3D-prospective bypassed pay areas, south of (down-dip to) a known active water contact, are shown as thick areas of low-D3D-impedance. It is significant that, early in the life of this field, a number of wells lined up north-to-south along the westernmost fault block, logged different oil-water contact elevations. This demonstrated that multiple oil-water contacts existed in this complex, overlapping-deltaic-sand-lobe reservoir. See the four different-colored compartments seen by the JGW "shrink-wrap" display (around four discrete D3D-impedance-resolved compartments), in the upper-right corner of Figure DvC1-10.
The right-hand panel of this Figure shows a possible "horizontal" well path, recommended to be drilled down to the "O" sand and then along the D3D-identified thickest low-impedance sand, as shown. The fear of depleted-reservoir-pressure drilling problems made this particular well path unfeasible, in 1999.
|

