|
 DvC1-10 (ST26 D22st Jason Shrink-wrap & Logs) DvC1-10 (ST26 D22st Jason Shrink-wrap & Logs)
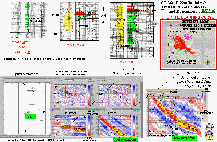
Figure DvC1-10 is a montage showing some of the educational aspects of the first offshore well to be partially guided by a D3D-impedance image, the D22st at ST-26. Starting in the lower-right corner, and moving clockwise, the montage shows:
(L-R) North-South D3D-impedance seismic section across the D22st well, with the low-impedance "O" sand represented by the yellow-red-pink colored layer. The lowest D3D-impedance VOXELs (interpreted to be high-GOR oil pay when the seismic data were shot in 1996) are colored yellow. Note that the D22st well path drilled into a 2-VOXEL-thick (8 ms = 40 feet) zone roughly correlative with the good quality gas and oil sand, shown on the "O" sand, log above it. The unproduced D10 (multiple-lobed) gas sand is seen up-dip and to the left of the D22st, and the not-yet-depleted (in 1996) C-15 (single, massive-lobed) well is shown down-dip to the right.
(L-L) the lower-left panel shows crossing lines through the directional D22st well and its "O" sand take point. The upper lines show the more regional views, with the "O" sand D3D-impedance seismic response terminating up-dip, onto the (faulted top of the Bay Marchand salt massif, and the lateral traps formed by the graben-flanking faults on the east and west of the ST-26 "O" sand field. It is significant to the D3DSP-goal of locating subtly trapped hydrocarbons, that these ~100 million barrels of oil are trapped in a graben, down-dip from the large, Bay Marchand salt dome field. The lower set of lines is the "zoomed" versions of the upper, regional lines. Notice the internal-to-the-O-sand-layer, yellow (low-D3D-impedance) VOXEL character and compare it to the log cross-section in Figure DvC1-05. On the logs, everything colored (blue or yellow) is considered "O" sand facies, but the best reservoir sands are colored yellow ... as they are on the D3D-impedance seismic.
(U-L) The gamma ray and induction (resistivity) log response of a slightly shallower N4 laminate oil sand. Not much D3D response from these poorly developed sand stringers.
(U-MID-L) The upper-left-middle panel show shows the log responses from a very clean, "N10" distributary channel sand, near the "O" sand deltaic system, and the (~24-feet of brown = one-4ms-VOXEL) "neutron-density" crossover signature denoting the gas on high-GOR oil. The logged transit-time and density (acoustic impedance) of the gas and the oil are very similar, but the water bearing sands are noticeably higher impedance. These logs are shown on the L-R panel, but very faintly.
(U-MID-R) The gas-on-oil "O" sand log response, showing ~ 40-feet of crossover, that the D3D-impedance was interpreted to show clearly.
(U-R) The Jason Geoscience Workbench (JGW) "shrink-wrap" display that demonstrated (post-mortem) the westernmost fault block actually consists of four (or five?) compartments that are colored pink, cyan, yellow, brown (and red?). The initially water-free, superb, D22st well drilled into a 100,000 barrel compartment (upper-left tip, in pink) that was NOT seen in the pre-drill D3D-impedance interpretation ... because
(1) The JGW software had not yet been licensed;
(2) Only standard vertical-view lines and map-view slices of the conventional and D3D-impdance data were employed (on which the overlapping, shingled boundaries between the sand bodies could not be seen, on conventionally processed data, and were never D3D-investigated ... only looking for the thickest, water-free sand target); and
(3) The exploitation goal was to sell this first well to the new purchasers of the ST-26 field.
This 100mboe compartment (had it been sought or seen) would not have met the 12,000-foot drilling economics requirements. The D3DSP received a serious black-eye when, after three months, the well went off having only produced 100,000 boe (but at an 1,111 boe per day, average rate!).
|

