|
DvC1-11 (ST23 - D3DSP vs Conv. Technology) - 
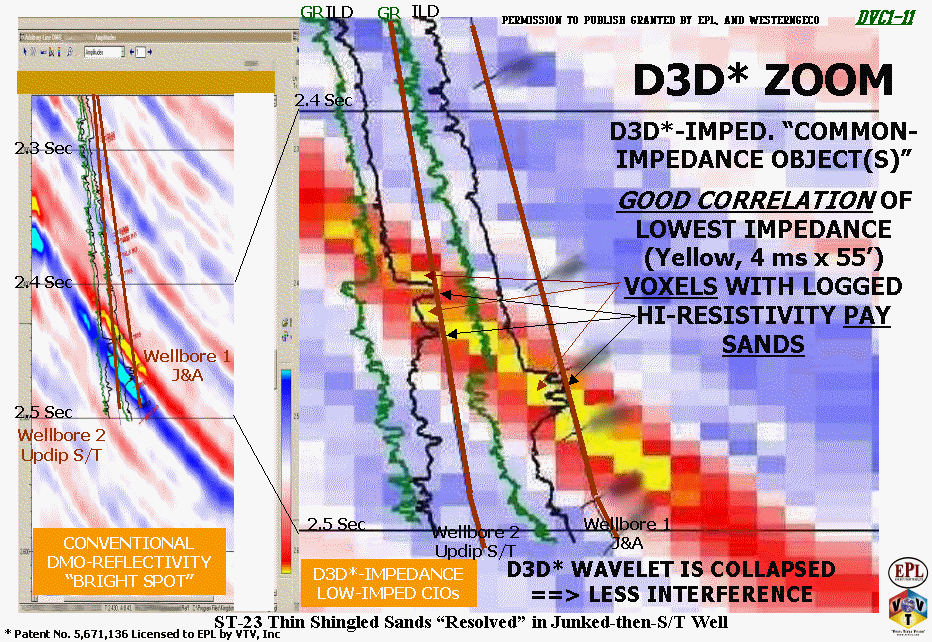
Figure DvC1-11 is a classic example of two contrasting exploration/exploitation tools:
(Left) Conventional "Bright Spot" technology, and
(Right) Diagnostic 3D Seismic Process (D3DSP) technology.
The right-hand well bore (brown) was drilled, produced, and then junked and abandoned (J&A), prior to the acquisition of these 1996 spec-3D seismic data. It is located in South Timbalier Block 23, just north of the ST-26 "O" sand field, previously used as an example, and was probably drilled originally on a proprietary 2D or 3D survey, shot and processed to look for faulted structure and amplitude anomalies (such as the conventionally processed, variable-density, colored-reflectivity-amplitude display, shown on the left panel). The gamma ray and resistivity logs from this discovery well are shown in green and black, respectively, to the left of the borehole, and they show what was interpreted to be a single, approximately 60-feet thick sand, full of oil to its base (no water contact). Two or three thin shale "breaks" can be seen in this sand, on these logs, but they were not anticipated to form any serious production barriers. It is not clear if they contributed to the junking of the well.
But after the original well was J&A, the up-dip side-track was drilled based on the single, conventionally attractive, yellow-over-cyan Bright Spot, seen on the left-hand display. Negative-sample-value "troughs" are red (and yellow). Positive-sample-value "peaks" are blue (and cyan). This is a classic Positive Physical Polarity BS (symmetric high-amplitude trough-over-peak), where the top of the low-impedance sand produces an inverted polarity wavelet, which constructively interferes (large sum) with the first trough-side-lobe of the normal polarity wavelet that reflects from the base of the sand (or top of a higher impedance shale). The Bright Spot shows no indication of any internal lithology or fluid changes, and the up-dip side-track was expected to nicely replace the J&A down-dip well.
In 1999, the left-hand side-tracked well bore was logged, and TWO relatively clean zones are seen to sandwich a silty, lower-resistivity zone. The right panel D3D-impedance line shows pretty clearly the two, "yellow shingles" of very low-D3D-impedance VOXELs that are interpreted to be the cleanest sand members found on the logs. It is significant that the thickness of each of these two, clean sand members is approximately 20-feet, or roughly one (4 ms) VOXEL, at 10,000 feet per second. So this simple, all-opaque D3D-impedance line (no VoxelGeo transparency or volumetrics used) demonstrates again the resolving power of a D3D-reprocessed data set, while other examples shown on this Website suggest that re-sampling to 2 (or 1?) ms, perhaps combined with some smart trace-interpolation, would have produced even higher resolution. The 2 or 3 shale breaks, within the original well's more massive sand (down-dip) might even have been interpretable on such D3D-reprocessed data.
|

