|
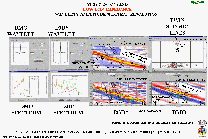
 DvC1-12 (ST23 - Amplitude Spectra D3D vs B. S.) DvC1-12 (ST23 - Amplitude Spectra D3D vs B. S.)
Figure DvC1-12 is another look at the same (Bright Spot) B.S. vs. D3DSP example shown in Figure DvC1-11. Here the wavelets from the conventional processing and the D3D-reprocessing are compared, along with the amplitude spectra for the respective reflectivity volumes. D3D-reflectivity is very hard for a classically trained interpreter's eye to look at, much less interpret. But that is because real buried rocks have many, many changes in acoustic impedance (density X velocity), both laterally and vertically, that are usually ignored or filtered out in the conventional processing flow.
These displays were produced by SMT's Kingdom 3dPAK, which is a "conventional", layer-based-earth-assumptions, interpretation and analysis tool. 3dPAK, therefore, defines the higher frequency portion of the D3D-reflectivity amplitude spectrum as NOISE, as shown by the lower gray curve on the right-hand D3D-reflectivity spectrum.
The vertical lines on both the conventional (left) and D3D (right) amplitude spectrum graphs, mark the 32, 64, 96 Hz frequencies. In the side-track well, the two sands (shown as single, yellow, 4-ms-samples, or VOXELs), appear to be separated by 12 ms (two-way-time) on the D3D-impedance display (upper middle, and also in Figure DvC1-11). Because the frequency is defined as the inverse of the period, and in order to produce this time separation requires a "Fourier period" of 12 ms, this implies that there must be a (1/0.012 seconds per cycle =) 83.3 Hz component to the D3D-impedance trace, and also to the D3D-reflectivity trace, from which it was derived. So, these high frequency, trace "wiggles" that correlate to the logged pay sands, must be geophysical SIGNAL. The logged well data says emphatically that these thin, commercial, pay-sands, separated by about twelve milliseconds, are definitely valuable GEOLOGICAL signal.
|

