|
 DvC1-13 (ST26 - Infill D-31 Well, D3D vs DMO) DvC1-13 (ST26 - Infill D-31 Well, D3D vs DMO)
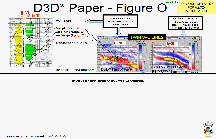
Figure DvC1-13 shows a gamma ray and resistivity log across the ST26 D-31 in-fill "O" sand well, drilled soon after the apparently successful D-22st well was completed. It also shows a set of "twin" N-S lines across the D-31 well’s “O” sand take-point, and compares:
D3D-impedance (with log curves) ... Versus ...
Conventionally processed (RUNSUM-impedance) data, and the same log curves.
Note that the bright yellow "low-impedance anomaly" on the conventional line (right) is quite broad and featureless over 800 feet, and so the conventionally defined target radius was approximately +/- 400 feet. Without a pin-point target prescribed, the driller was permitted to allow the naturally drifting drill-bit to penetrate the "O" sand anywhere within this conventional target radius.
The D3D-impedance data (left), on the other hand, suggests that (totally in hindsight) moving the "Top O Sand" tag point, four traces (330 feet) west COULD have resulted in logging a thicker high-oil-saturation sand and, thus, an easier "O" sand completion, than was provided by the thin oil sand surrounded by water-swept lobes, interpreted in the well bore that was drilled. This made completion attempts fail, because there was just too much water, too close ... at least, at this local spot in a compartmentalized and water-flooded reservoir.
|

