|
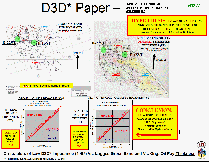
 DvC1-14 (ST26 - "O" Gross & Net Pay Cross-plots) DvC1-14 (ST26 - "O" Gross & Net Pay Cross-plots)
Figure DvC1-14 shows the montage that was built to answer two understandable concerns:
"How do we know the D3D-impedance distribution is not showing us
... Gross ‘O’ sand thickness, OR
... “Original Net Pay” (original oil-in-place)?"
We want to see the distribution of recoverable hydrocarbons when the survey was recorded (1996), not a historical bit of trivia.
To answer these critical questions, detailed geological contour maps of both of these (interpreted from logs) thicknesses were retrieved from the in-house files that were transmitted when the field was purchased, in 1998. These maps showed thickness data annotated at the "O" sand tag point of every drilled well. "D3D-impedance (seismic) thickness vs. wireline-logged thickness" cross-plots were constructed by manually overlaying the "Thickness of the low-D3D-impedance CIO" seismic map (left side of Figure DvC1-09), onto each of the contoured maps shown above. The result of each of these overlay-tabulate-and-cross-plot exercises is shown on the bottom of this Figure. Each posted "dot" represents one drilled well, and its position on the graph corresponds to the value of the logged thickness (horizontal axis) and its D3D-impedance thickness (vertical axis).
For the "Gross 'O' Sand Thickness" cross-plot, the logged gross thickness values were displayed along the horizontal axis, and the "low D3D-impedance" seismic thicknesses (from Kingdom calculations based on the JGW exported top and base horizons) were displayed along the vertical axis. If the D3D was, indeed, reacting to the gross sand thickness, then the cross-plot points would have scattered close to the red diagonal line, along which, Logged Thickness equals D3D-impedance Thickness. But it was clear from the left-hand graph that the D3D-impedance thicknesses were always, at every well, much thinner than the logged gross sand thickness. And not scattered all over the graph, but consistently well below the red line.
The "Original Oil Pay Thickness" cross-plot was even more interesting. It showed that the D3D-seismic thicknesses were always thinner than the original pay thicknesses but, at many of the well spots, D3D-seismic thickness values were only slightly less than the original pay thickness values, even though these wells were believed to have been depleted or watered out. This suggested numerous field development scenarios that were not carried out … ostensibly, for many good (conventional) reasons.
In any case, the D3D-impedance thicknesses do NOT seem to represent either gross sand or original (now, residual?) pay sand thicknesses. The D3DSP contended that the "Low D3D-impedance Isopach" map could have been used to map areas of thick, recoverable hydrocarbons ... like in the down-dip "bypassed pay" areas, mentioned in Figures DvC1-07, 08, and 09.
|

