|
 DvC2-07 DvC2-07
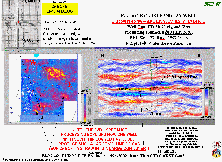
In November, 2002, when the D3DSP evaluation was nearing completion, published information had the Norcen #2 well CIB CARST sand (in EI-46, upper left corner) at over 20 bcfge of cumulative production, with only a small pressure drop (indicating a strong water drive) and still making 13 million cfge per day, on its latest published report (July 2001). But industry scouts reported that its production was beginning to show increasing water cut, and an approximate 29 bcfge Estimated Ultimate Recovery (EUR), was being assigned. This was much higher than the 5.9 bcfge calculated from the 244-acre size of its non-D3D amplitude anomaly (see the bottom of the conventional amplitude map on the left side of Figure DvC2-05). This formerly unpredicted quantity of gas, combined with the difficulty in creating a synthetic seismogram model showing a bright amplitude response from this poorly developed (less than 20-foot thick) sandstone, added yet another puzzle to the risk picture for this EI-27 prospect, where the Norcen #2 drill site was well within the Bright Spot anomaly outline on the conventional amplitude map. Figure DvC2-07 shows how each of the thin-logged-sand (upper left corner), amplitude-anomaly-quality, and small-mapped-area problems were resolved by the application of the D3DSP.
The D3D-impedance CIB CARST sand "horizon amplitude" map is shown, again, in the lower left corner, below the annotated CIB CARST sand well log. The location of the Norcen #2 well is circled on the map, and pointed out by a black arrow. Notice that it sits on the locally-southern edge of a re-entrant in a large, sprawling, pink-red-and-yellow feature interpreted to be the CIB CARST sand (low D3D-impedance CIO, after it has been "seeded and grown" in VoxelGeo). This edge-position explains the thin sand found on the well log. The TWT-contours, shown in Figure DvC2-06, indicate its high (2.76 sec) position relative to most of the (pink and yellow) low-D3D-impedance areas of sand deposition, explaining its extraordinary long-lived, water-driven gas production (from such an enormous, down-dip "fetch" area).
The track of the portion of the north-south ("N-S") arbitrary line, crossing this well, is shown by the portion of the red index line between the black "N" and "S". A zoomed-up piece of the D3D-impedance arbitrary line, itself (as opposed to a N-S inline or an E-W crossline, from the Fairfield 3D survey), is shown on the right side of the Figure. The Norcen #2 well position is shown, long with a green Gamma Ray (GR) log curve and a black SP curve, to the left of the vertical well path, and a black Deep Induction (ILD, resistivity) curve, to the right. Once again, the CIB CARST sand perforations (" < 20 ft Logged Pay" arrow) are seen to be in a high position, just on the southern edge of a much larger low-D3D-impedance (red-and-yellow) event. The event "horizon" interpreted to produce the D3D-impedance-amplitude map, and TWT-structural contours, is the faint green line tracking through the middle of the "CIB CARST sd" seismic event. Note that it jumps up and down to "snap" to the minimum impedance sample on each trace, and that each D3D-seismic sample (VOXEL) is represented by a small, colored rectangle.
The zoomed image, in the following Figure DvC2-7A, shows that there are a couple of stacked yellow VOXELs at exactly the perforated depth (or TWT), on the Norcen #2 well path (dashed line). Each of these VOXELs (or seismic samples) is 2 ms thick, or 16 feet, using the 8000 feet per (2-way-time) second gas sand velocity logged in this well. This, indeed, is an example of the (D3D-processing) tuning effect coming in to play, but at a much thinner sand value (< 20-feet, at a depth of over 10,000 feet). The 100+ Hz (D3D- reflectivity) wavelet signal frequencies, discussed with Figure DvC2-09, are apparent on the highly zoomed image, below. The higher signal-frequencies, achieved through the use of the "object-oriented" D3D-processing phase, explain the difference between the "qualities" of the two different Norcen #2 CIB CARST sand "amplitude anomalies". One uses conventional layered-earth-assumption reflectivity amplitudes, from a data volume in which every attempt was made to insure that non-layered (e.g., discontinuous) peak-and-trough energy was removed prior to delivery of the final processed product. The other was from a D3D-impedance volume (running-sum-inverted from D3D-reflectivities), in which anomalously low-D3D-impedance amplitudes are always preserved, regardless of how they fit into the (no longer required) layer-earth model. The D3DSP contends that this CIB CARST sand is better described as "an object", perhaps resting within a classic geological CIB CARST sand, depositional layer.
|

