|
 DvC2-08 DvC2-08
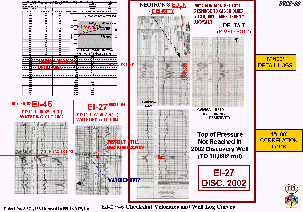
Figure DvC2-08 shows analyses of the three velocity surveys in the area, from which the EDT (Estimated Depth T'ube) was constructed (upper-left corner), and the three key producing well logs ... none of which had been shot for time-depth relationship velocities. The velocity survey analysis showed that the velocities down to the CIB CARST sand, in this area, seemed quite uniform (they track on top of one another when plotted in Excel), and that was supported by stacking velocity analyses during the D3D-reprocessing phase. The top of "geopressure" (where ancient, un-expelled fluids start, dangerously to drillers, to bear the weight of the overlying rocks) is easily picked on these velocity survey Interval-Velocity-versus-TWT (or depth) plots. The CIB CARST sand was correctly D3D-predicted to be above this critical depth, so protective casing was not recommended for the drilling cost estimate.
Earlier conventional interpretations, based on a published 40-foot elevation for the Odeco #4 "Kelly Bushing" (KB, or log zero-reference-depth), had suggested that a slowing-to-the-west, depth-conversion velocity-gradient might be present, putting the proposed exploratory drill site (amplitude anomaly) in a more attractive, up-dip, "attic" position with respect to the water-out Odeco #4. But no evidence of this suspected gradient was found in either the local velocity (checkshot) survey comparisons, or in the seismic stacking velocities. In fact, a 33-foot higher KB elevation for the 1977 Odeco #4 well ("KB=73'" was found written in pencil on an old file log, submitted to the MMS) permitted the D3DSP-mapping to show the Odeco well up-dip from the (conventionally chosen) EPL #1 anomaly and proposed location, with a simple, no-gradient, depth-converted map.
The lower-left log is from the EI-46 1996 Norcen #2 gas discovery, whose D3D-CIO calculated very near the well's 29 bcfge EUR. The thin pay zone on the log conflicted with the bright amplitude surrounding it, on the conventional amplitude map, but not with its position on the edge of the much larger D3D-Common-Impedance-Object (seen in map-view in Figures DvC2-05, -06, and -07). The VoxelGeo impedance cutoff value that produced the Norcen well's 29 bcfg reservoir-CIO, was used to produce the final EI-27 EPL #1 reservoir CIO with its flat base, and very slight (just one VOXEL on the NW edge of the CIO) contact with the Odeco #4 well. The cutoff value (-68) that resulted in the maximum sizes for the two D3D-CIOs, shown on the D3D-map-views in Figure DvC2-05, was chosen because its application resulted in a CIO, immediately prior to the slightly higher cutoff value (-66), that was interpreted to have detected wet sand VOXELs (see second-from-left frame on bottom row in Figure DvC2-12). This use of size and shape characteristics of VoxelGeo's sequentially detected CIOs, to arrive at a final interpretation of the size and shape of a prospective reservoir, will be discussed in the caption to Figure DvC2-12.
The lower-center log is the equally problematic, old (Texaco deep, then) Odeco #4 log, with its questionable KB, its apparent slight communication with the larger EPL #1 CIB CARST reservoir (based on similarly reduced pressures in the two wells), and its "watering-out" up-dip to EPL's highly commercial gas (possible bypassed pay, re-) discovery. Its possible position within the complex CIB CARST reservoir is shown schematically by the vertical dashed red line on Figure DvC2-02. The sand that watered out may have been the lower, thin, perforated sand stringer on the log in this Figure (see the zoomed image in the following Figure DvC2-8A). The upper thin sand, within the 32-foot perforated interval, may be connected to the main, down-dip, EI-27 CIB CARST sand reservoir. But in its edge position, and only a possible 2-feet of perfs, it could not overcome the high water-cut, once the lower sand was produced (8.2 bcfg).
The right-hand log exhibits various log curves measured across the CIB CARST sand in the EPL #1 discovery well. The upper-right, compressional-wave, transit time log (black curve under the red dashed shale-base-line) shows an almost non-existent low-velocity-effect due to the presence of gas in the sandstone. Whereas, the Bulk Density curve (to its left) shows quite a large decrease in the (g/cc) density values across the high resistivity gas-bearing sandstone zone. This high-velocity, but low-density, reservoir property was attributed to the relatively high level of cementation found on a Dipole-Sonic log (reading shear-wave velocities and "sand strength") in this porous, middle-Miocene aged, sandstone channel. The high-rate production that it allowed (> 30 mmcge per day, for a few weeks in 2003) continues to be an added bonus for this highly commercial (D3D-technical-) success story. The low-D3D-impedance CIO and the conventional amplitude anomaly, were both produced by a nearly pure density anomaly, (at least at the EPL #1 well bore location).
|

