|
 DvC2-11 DvC2-11
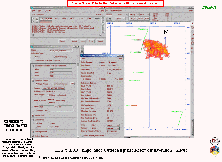
Figure DvC2-11 is the "Cutoff = -68" frame of the "evolution movie" (every frame of which is shown in Figure DvC2-12). This animated CIB CARST sand evolution movie can be viewed under the "Multimedia Animations" button, on the VTV Home Page. These image frames are not horizon-amplitude maps, but are map-views of three-dimensional Common-Impedance Objects (CIOs). This one is D3D-interpreted to be the recoverable-gas-filled CIB CARST sandstone reservoir, discovered (or RE-discovered, as it may be considered to be "bypassed pay", left behind by the [unavoidably] prematurely abandoned Odeco #4 well, located at the vertex of the two green directional wells to the west) in December, 2002, by Energy Partners, Limited (EPL).
Notice the characteristic meander shape to the SW (lower-left) portion (and perhaps better seen in Figure DvC2-07) of the generally reddish, low-impedance CIO. The lowest D3D-impedance VOXELs are shown in an opaque yellow color, and they are surrounded by more translucent, red and pink VOXELs. Because of this volume-visualization, variable opacity feature of VoxelGeo, one can "see inside" this common-impedance object. The blue cross-hairs are VoxelGeo indicators of the seed point (X, Y) coordinates, which is exactly at the discovery well's nearly vertical path. It evidently hit near the center of a very clean, porous but well-cemented, gas-filled (submarine channel?) sand, as evidenced by the transit-time and bulk density log signatures, shown on the right side of Figure DvC2-08. There is a very good gamma-ray signature (lower right-hand log on Figure DvC2-08) for a clean, shale-free sandstone, and very little slow-down in the velocity of the gas sand, indicating tight cement between the middle Miocene-age sand grains. But not so much cement that the porosity was destroyed, as indicated by the significantly low bulk-density anomaly that contributed heavily to the low-D3D-impedance seismic response.
The connection of this SW meander to the other yellow VOXELs (sand lobe?), to the northeast (again, also see Figure DvC2-07), was confirmed by bottom-hole pressure jumps during the early weeks of flow into the sales line. The flat base long the eastern edge may be a "paleo" water contact, below which (over millions of years of burial) the down-dip porosity was cemented by minerals carried by the flowing aquifer brines. This is supported by the present response of the (wonderful) reservoir, in which its pressure is dropping consistent with a large closed container ... not gas sitting on movable water.
The text and tables of numbers on the left of the Figure are presented by VoxelGeo after each successful "seed-detection" operation, and reveal such useful information as the
(X, Y, TWT) coordinates of the seed point,
D3D-impedance value at the "Starting Seed Point" (-127 to +128),
Detection criterion (or D3D-impedance "cutoff" value -- detected VOXELs will have D3D-impedance values less-than-or-equal-to the cutoff value),
The number of adjacent VOXELs to be queried for detection (6 face-connected, only, or 26 including edges and corners),
Map-view area of the CIO,
Total volume (and sand interval-velocity [f/s] used in its derivation),
Minimum, Maximum, and Average thickness of the CIO, and
Minimum and Maximum values for the (X, Y, TWT) coordinates.
VoxelGeo-type volume-visualization and volumetric-analysis capabilities are absolutely essential for the efficient and effective use of the Diagnostic Three-dimensional Seismic Process.
|

